 ICON Insights | April, 2026
Dr. Craig Callahan ICON Advisers – Founder & Executive Committee Chair
Equities
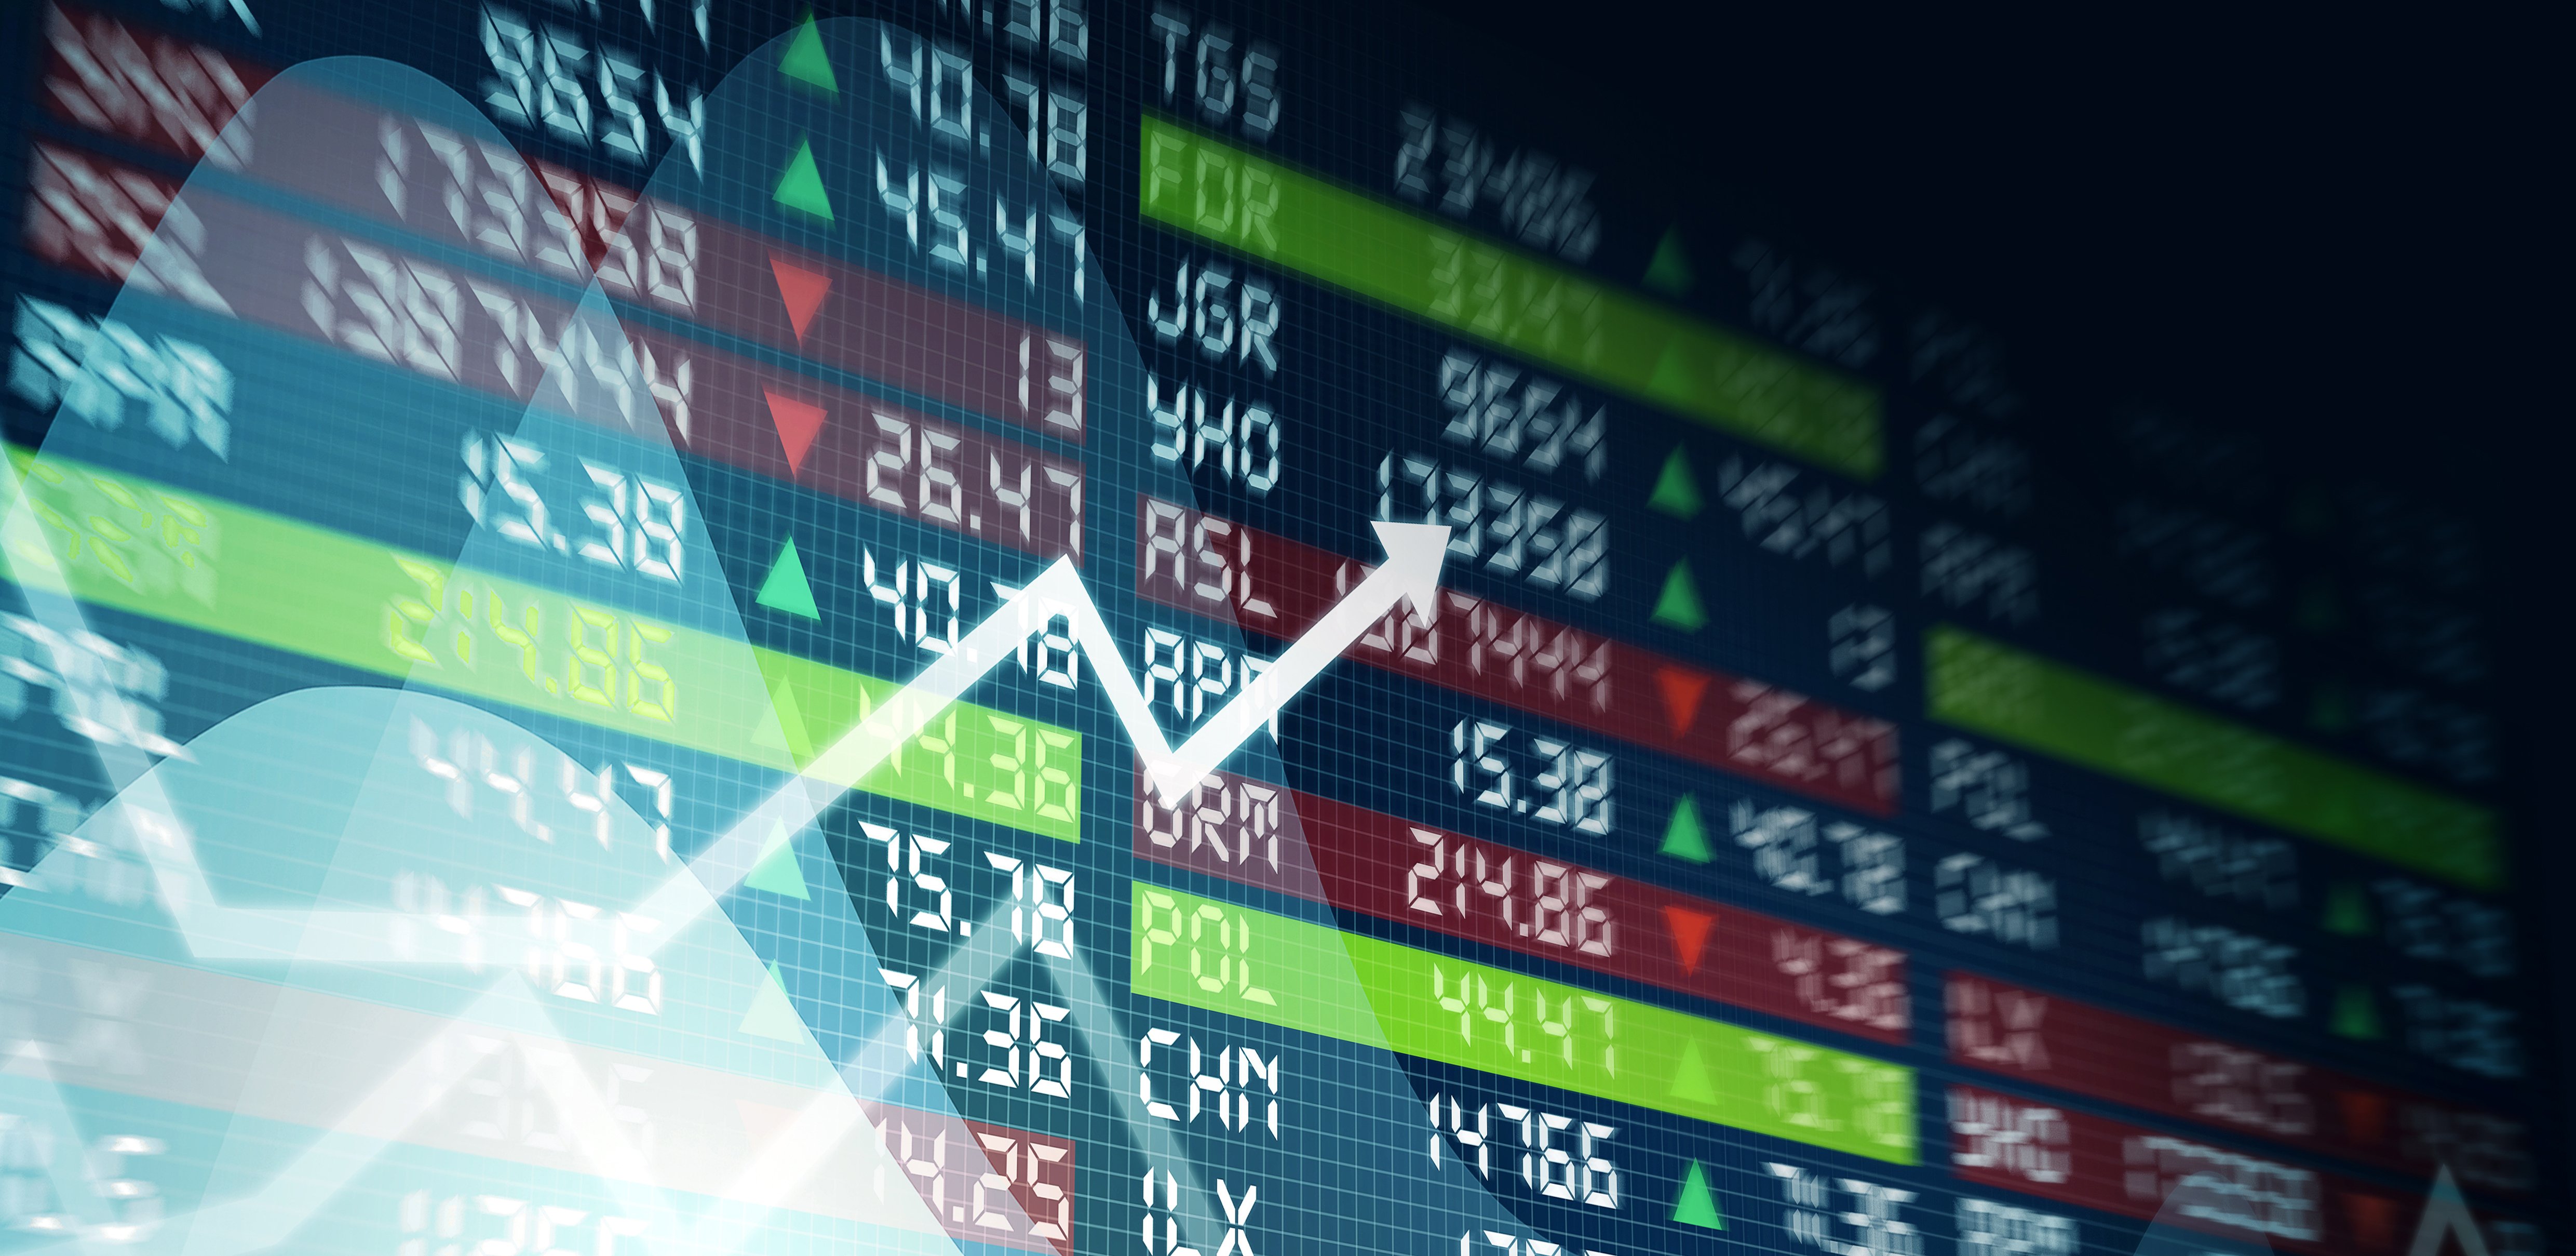
![]() The S&P 1500 Index finished February down 0.44% for the month but still up 1.23% for 2026. From the low of April 8, 2025, through its recent high on February 9, 2025, the index gained 41.38%. We view its sideways, choppy path since that high as just a pause after a tremendous advance. The pause in the final three weeks of February occurred despite positive earnings announcements. As of March 2, 2026, 1424 of the companies in the S&P 1500 Index announced quarterly earnings. On average they beat estimates by 5.09%. The first table, at right, shows the top three sectors beating estimates were Industrials, Materials, and Energy. Year over year growth for all companies, on average, was 10.74%. The table also shows the three sectors experiencing the most growth were Information Technology, Industrials, and Materials. As the earnings were greater than expected and growing from a year earlier, they don’t explain the market’s pause in late February.
The S&P 1500 Index finished February down 0.44% for the month but still up 1.23% for 2026. From the low of April 8, 2025, through its recent high on February 9, 2025, the index gained 41.38%. We view its sideways, choppy path since that high as just a pause after a tremendous advance. The pause in the final three weeks of February occurred despite positive earnings announcements. As of March 2, 2026, 1424 of the companies in the S&P 1500 Index announced quarterly earnings. On average they beat estimates by 5.09%. The first table, at right, shows the top three sectors beating estimates were Industrials, Materials, and Energy. Year over year growth for all companies, on average, was 10.74%. The table also shows the three sectors experiencing the most growth were Information Technology, Industrials, and Materials. As the earnings were greater than expected and growing from a year earlier, they don’t explain the market’s pause in late February.
![]() We think the pause in February was due to many investors anticipating the military action in Iran. Some investors and their investment systems are not affected by, and ride through, regional military conflicts. Many other investors, however, don’t like the uncertainty surrounding war of any type and sell their stocks. It appears to us that the selling in February was from investors who believed the invasion of Iran was very likely. A mode of sell first and ask questions later.
We think the pause in February was due to many investors anticipating the military action in Iran. Some investors and their investment systems are not affected by, and ride through, regional military conflicts. Many other investors, however, don’t like the uncertainty surrounding war of any type and sell their stocks. It appears to us that the selling in February was from investors who believed the invasion of Iran was very likely. A mode of sell first and ask questions later.
The second shows sector index performance for 2026 through February 27, 2026. It reflects the new, broader market we have been anticipating. Consumer Discretionary was dragged down by two components in the Magnificent Seven. Beyond those, there are industries in that sector we like. The lackluster performance of Financials is temporary in our opinion. We expect it to do better the rest of 2026.
Bonds
The yield on the 10-year Treasury dropped in February from 4.24% to 3.94%. We believe this is the flip side to the anticipation of war, the selling of stocks, and the purchase of bonds as a safe haven. A continued range around the 4% area makes sense to us.
Summary
There is an old saying that the stock market is a market of stocks. When we get down on the ground and go stock by stock by stock, we can find well managed growing companies with their stock prices below our estimates of fair value. We like owning them for the coming months.
The data quoted represents past performance, which is no guarantee of future results. Opinions and forecasts regarding sectors, industries, companies, countries and/or themes, and portfolio composition and holdings, are all subject to change at any time, based on market and other conditions, and should not be construed as a recommendation of any specific security, industry, or sector.
Investing in securities involves inherent risks, including the risk that you can lose the value of your investment. An investment concentrated in sectors and industries may involve greater risk and volatility than a more diversified investment. Investments in international securities may entail unique risks, including political, market, regulatory, and currency risks. In general, there is less governmental supervision of foreign stock exchanges and securities brokers and issuers. Investing in fixed-income securities such as bonds involves interest rate risk. When interest rates rise, the value of fixed-income securities generally decreases.
Individual account holdings and composition may vary. Opinions and forecasts regarding sectors, industries, companies, countries and/or themes, and portfolio composition and holdings, are all subject to change at any time, based on market and other conditions, and should not be construed as a recommendation of any specific security, industry, or sector.
ICON’s value-based investing model is an analytical, quantitative approach to investing that employs various factors, including projected earnings growth estimates and bond yields, in an effort to determine whether securities are over- or underpriced relative to ICON’s estimates of their intrinsic value. ICON’s value approach involves forward-looking statements and assumptions based on judgments and projections that are neither predictive nor guarantees of future results. Value readings are contingent on several variables, including, without limitation, earnings, growth estimates, interest rates, and overall market conditions. Although valuation readings serve as guidelines for our investment decisions, we retain the discretion to buy and sell securities that fall beyond these guidelines as needed. Value investing involves risks and uncertainties and does not guarantee better performance or lower costs than other investment methodologies.
ICON’s value-to-price ratio is a ratio of the intrinsic value, as calculated using ICON’s proprietary valuation methodology, of a broad range of domestic and international securities within ICON’s system as compared to the current market price of those securities. According to our methodology, a V/P reading of 1.00 indicates stocks are priced at intrinsic value. We believe stocks with a V/P reading below 1.00 are overvalued, while stocks with a V/P reading above 1.00 are undervalued. For example, we interpret a V/P reading of 1.15 to mean that for every $1.00 of market value, there is $1.15 of intrinsic value which has not yet been realized in the market price.
The unmanaged Standard & Poor’s Composite 1500 (S&P 1500) Index is a broad-based capitalization-weighted index comprising 1,500 stocks of Large-cap, Mid-cap, and Small-cap U.S. companies. The SmallCap 600 Index is an unmanaged index of 600 domestic stocks chosen for their market capitalization, liquidity, financial viability, and sector representation. The unmanaged Standard & Poor’s (S&P) Composite 1500 Sector Indexes track the performance of sectors that comprise the S&P Composite 1500 Index. Total return figures for the unmanaged sector indexes do include the reinvestment of dividends and capital gain distributions, but do not reflect the costs of managing a mutual fund. The Standard and Poor’s (S&P) 1500 Consumer Discretionary Index is an unmanaged capitalization-weighted index comprising companies in the Consumer Discretionary sector as determined by S&P. Total returns for the unmanaged index include the reinvestment of dividends and capital gain distributions beginning on January 1, 2002. Index returns with reinvested dividends and distributions are unavailable prior to that date. The Standard and Poor’s (S&P) 1500 Consumer Staples Index is an unmanaged capitalization-weighted index comprising companies in the Consumer Staples sector as determined by S&P. The Standard and Poor’s (S&P) 1500 Energy Index is an unmanaged capitalization-weighted index comprising companies in the Energy sector as determined by S&P. The Standard and Poor’s (S&P) 1500 Financials Index is an unmanaged capitalization-weighted index comprising companies in the Financials sector as determined by S&P. The Standard and Poor’s (S&P) 1500 Healthcare Index is an unmanaged capitalization-weighted index comprising companies in the Healthcare sector as determined by S&P. The Standard and Poor’s (S&P) 1500 Information Technology Index is an unmanaged capitalization-weighted index comprising companies in the Information Technology sector as determined by S&P. The Standard and Poor’s (S&P) 1500 Materials Index is an unmanaged capitalization-weighted index comprising companies in the Materials sector as determined by S&P. The Standard and Poor’s (S&P) 1500 Industrials Index is an unmanaged capitalization-weighted index comprising companies in the Industrials sector as determined by S&P. Total returns for the S&P 1500 Industrials Index include the reinvestment of dividends and capital gain distributions beginning on January 1, 2002. Index returns with reinvested dividends and distributions are unavailable prior to that date. The Standard and Poor’s (S&P) 1500 Real Estate Index is an unmanaged capitalization-weighted index comprising companies in the Real Estate sector as determined by S&P. The Standard and Poor’s (S&P) 1500 Utilities Index is an unmanaged capitalization-weighted index comprising companies in the Utilities sector as determined by S&P. Individuals cannot invest directly in an index.
The 10-year yield is the benchmark 10-year yield to maturity reflected by the current issue 10-year U.S. Treasury note.
Sources: Bloomberg
Please visit ICON online at ICONAdvisers.com or call 1-800-828-4881 for the most recent copy of ICON’s Form ADV, Part 2.
© 2026 ICON Advisers, All Rights Reserved.