 ICON Insights | February, 2026
Dr. Craig Callahan ICON Advisers – Founder & Executive Committee Chair
Federal Reserve
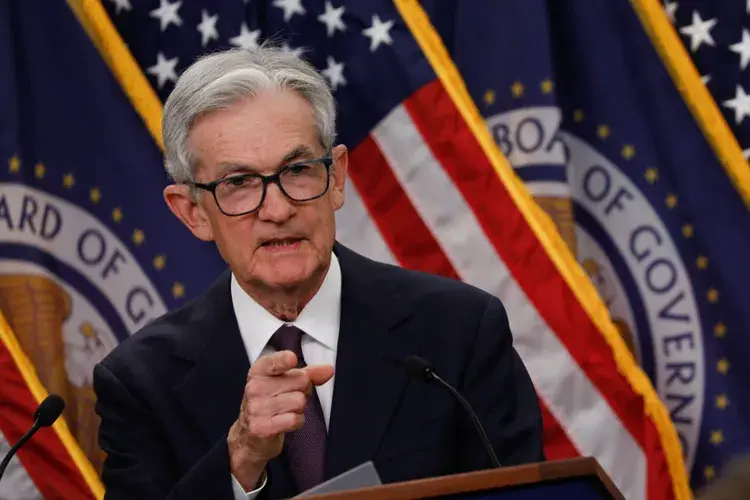
In May of 2026, the term of Chairman of the Federal Reserve (Fed), Jerome Powell, will end, and the President will appoint a replacement (with the approval of Congress). Normally, we would not write about this event, but it has the potential to be different this time and appears to already be affecting equity, debt, and commodity markets.
This administration has had a pattern with regard to appointments. During his first term, cabinet members and top executives were routinely fired for apparently disagreeing with the President, or at least not sharing his vision. In that setting, he did not accomplish much of his agenda. During this second term, there have been no firings, and much more of his agenda has been accomplished. It appears the President has learned to appoint people who always agree with him and share his vision.
The White House has been very critical of the Federal Reserve, demanding that interest rates be lower (easier monetary policy) and even threatened to attempt to fire Chairman Powell. It appears to us that Wall Street and investors globally are putting two-and-two together, anticipating that the next Federal Reserve Chair will be in total agreement with the White House.
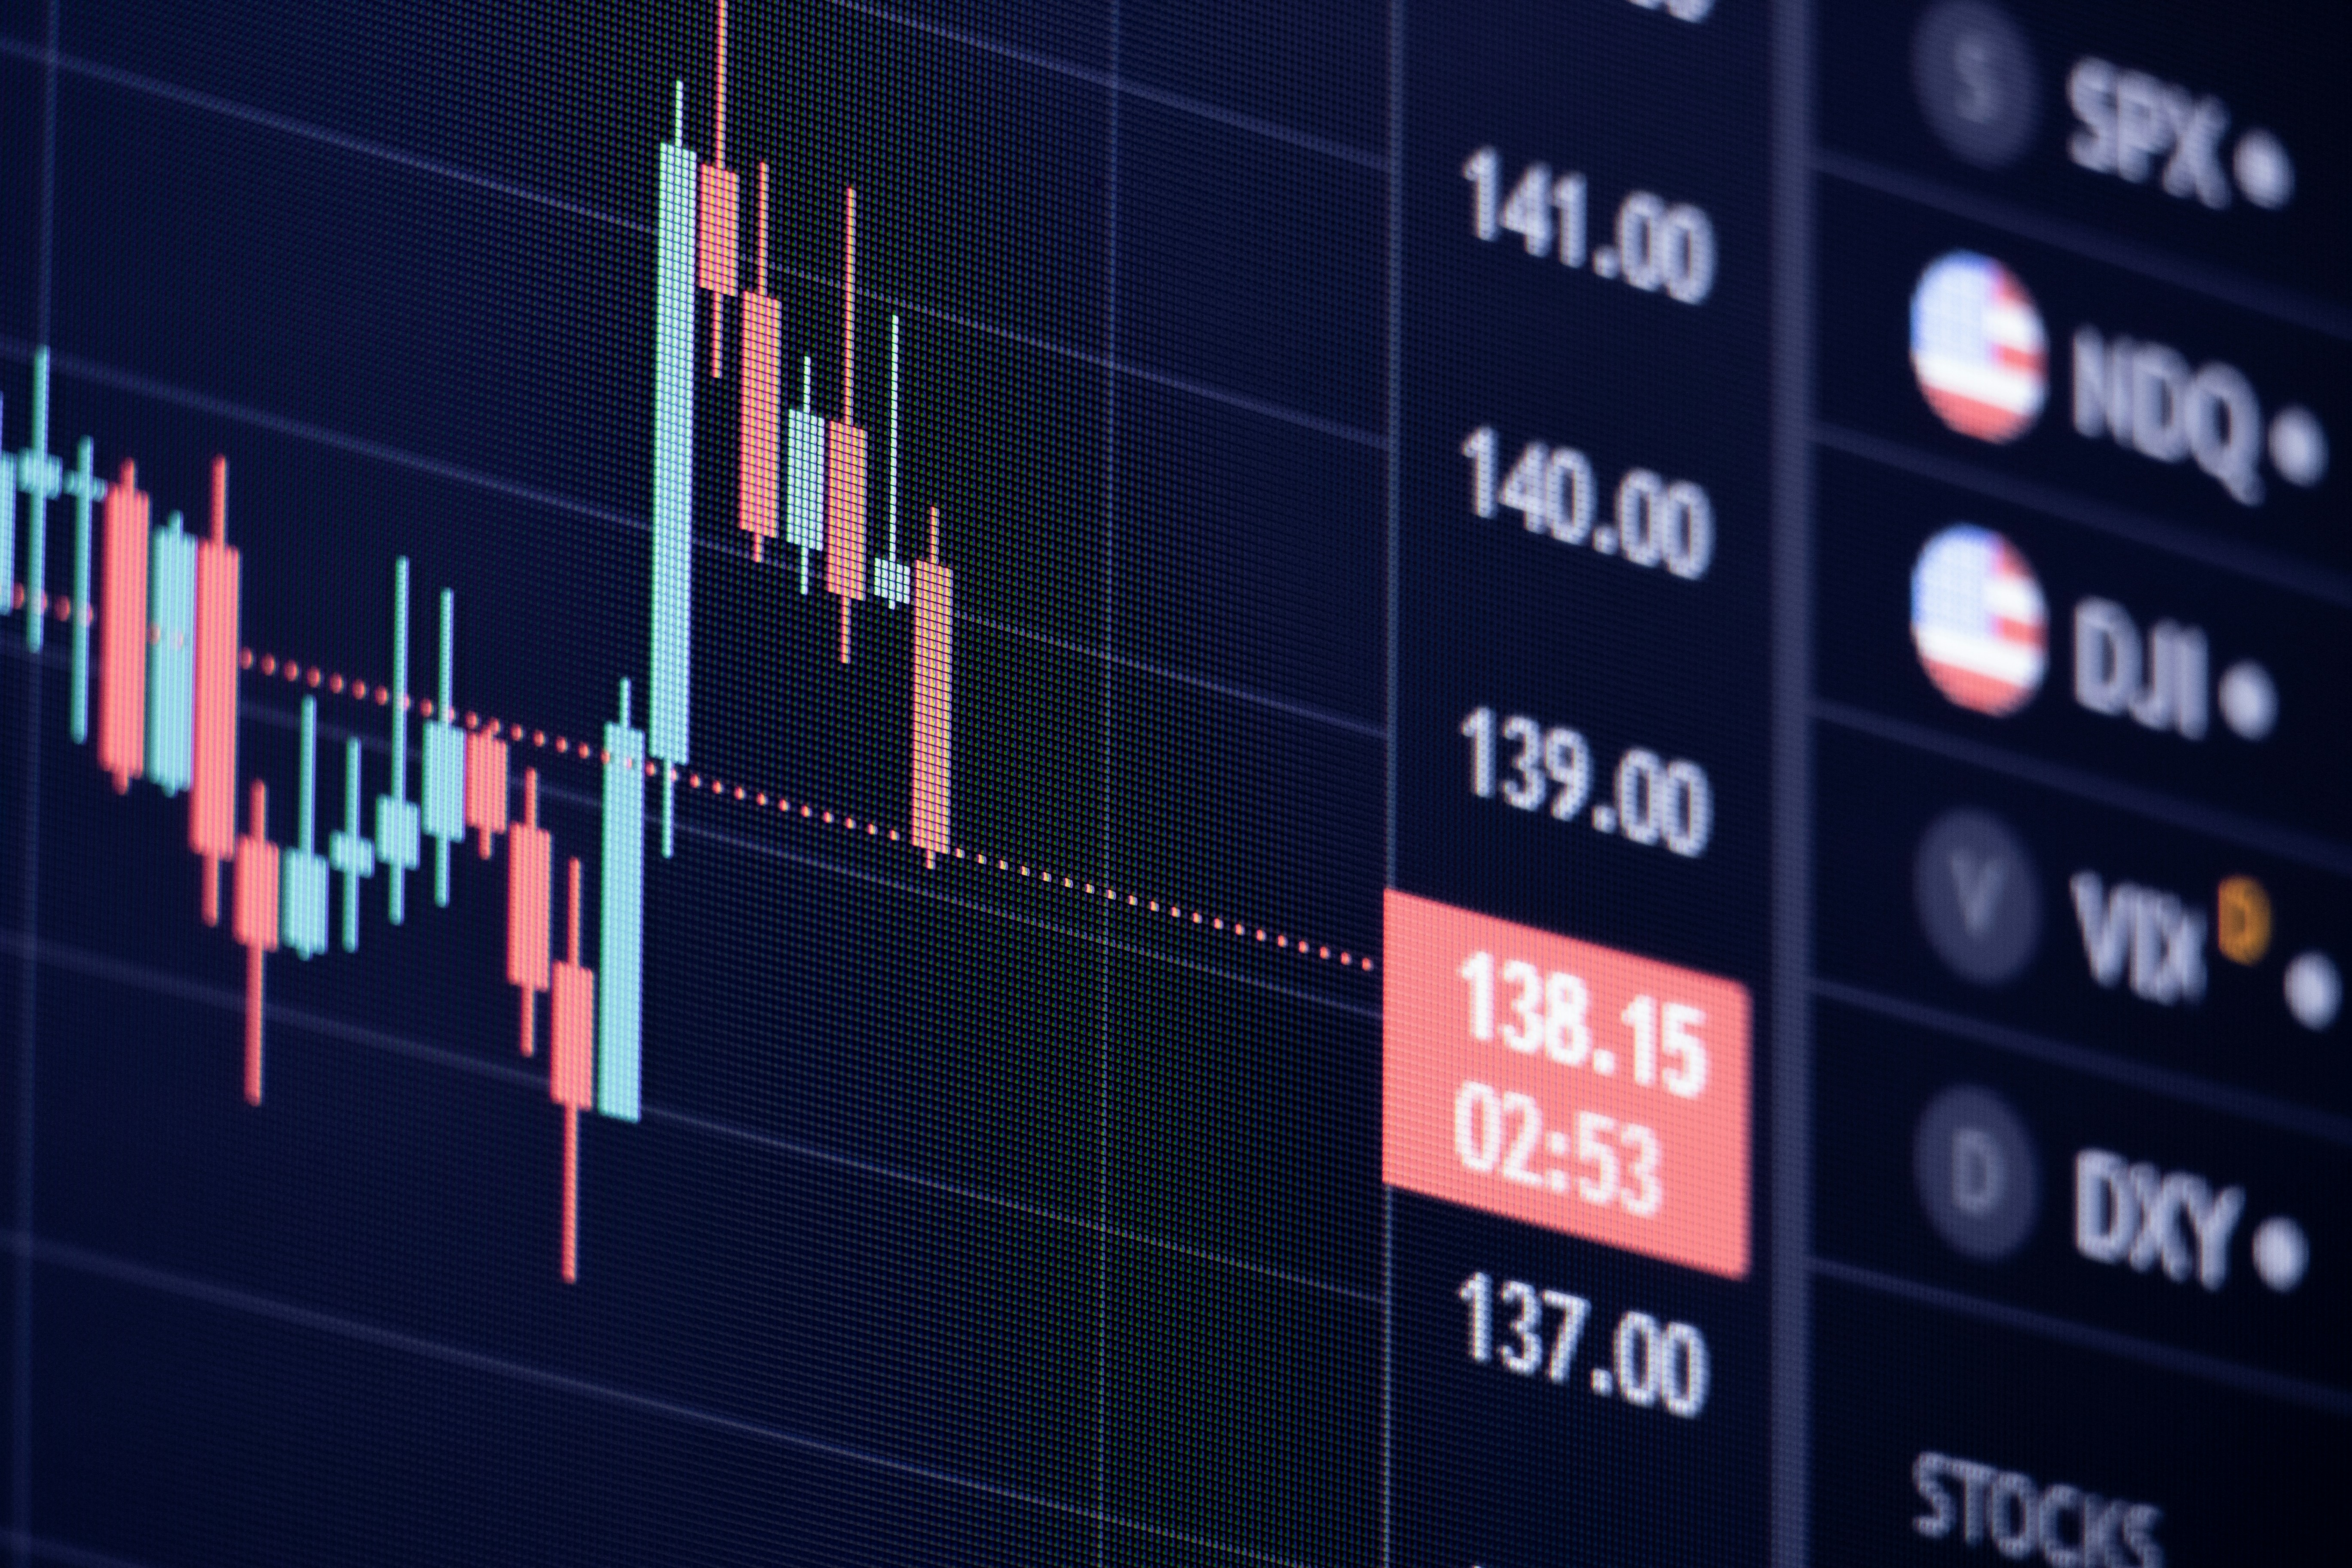
![]() If investors globally anticipate that the Federal Reserve would pursue “excessively easy” monetary policy, it would be good for gold and bad for the US Dollar. Short-term rates, where the Fed has its influence, would drop, but long-term rates, driven more by inflation expectations, would hold even – or potentially increase. US Stocks normally respond favorably to easing monetary policy, while emerging markets, many of which peg their currencies to the US Dollar, also benefit from Fed easing and a declining US Dollar. The table, at right, shows returns and changes in 2025. It appears global investors are anticipating much easier monetary policy out of our Fed. Gold was up; the US Dollar was down. Short-term rates dropped, but the 30-year Treasury yield rose slightly. Domestic stocks were up, and emerging markets almost doubled the US gains.
If investors globally anticipate that the Federal Reserve would pursue “excessively easy” monetary policy, it would be good for gold and bad for the US Dollar. Short-term rates, where the Fed has its influence, would drop, but long-term rates, driven more by inflation expectations, would hold even – or potentially increase. US Stocks normally respond favorably to easing monetary policy, while emerging markets, many of which peg their currencies to the US Dollar, also benefit from Fed easing and a declining US Dollar. The table, at right, shows returns and changes in 2025. It appears global investors are anticipating much easier monetary policy out of our Fed. Gold was up; the US Dollar was down. Short-term rates dropped, but the 30-year Treasury yield rose slightly. Domestic stocks were up, and emerging markets almost doubled the US gains.
The Fed had previously stated that its inflation target was 2%. We believe that is attainable, but the new Chair, if predisposed to easier monetary policy, may not share that 2% target. As we have written before, “we are on a very friendly Phillips Curve,” and the unique conditions of the pandemic, which contributed to the spike in inflation, are behind us. With easing monetary policy, we do not fear a spike in inflation given our current demographics, capacity utilization, and production capabilities. Instead, we would expect inflation to settle in the 3% area rather than the 2% target. In that setting, we would expect the yield curve to steepen.
We also can’t forget that the Chairman of the Fed does not set monetary policy alone. The Chair is just one member of the 12-member Open Market Committee, which meets eight times a year. The committee has been known for courteous and respectful debate and even occasional dissenting votes against the Chair’s position. If the new Chair wants to take monetary policy in a much easier direction, we will just have to wait and see how the committee reacts.
Equities
![]() Last year, from February 19, 2025, to April 8, 2025, the market took a two-stage tumble; initially in anticipation of tariffs and second when they were announced. During that low, we wrote that any inflationary impact would be just a one-time event, not compounding. That assessment was correct, and the market recovered nicely with the S&P 1500 index finishing up 17% for the year.
Last year, from February 19, 2025, to April 8, 2025, the market took a two-stage tumble; initially in anticipation of tariffs and second when they were announced. During that low, we wrote that any inflationary impact would be just a one-time event, not compounding. That assessment was correct, and the market recovered nicely with the S&P 1500 index finishing up 17% for the year.
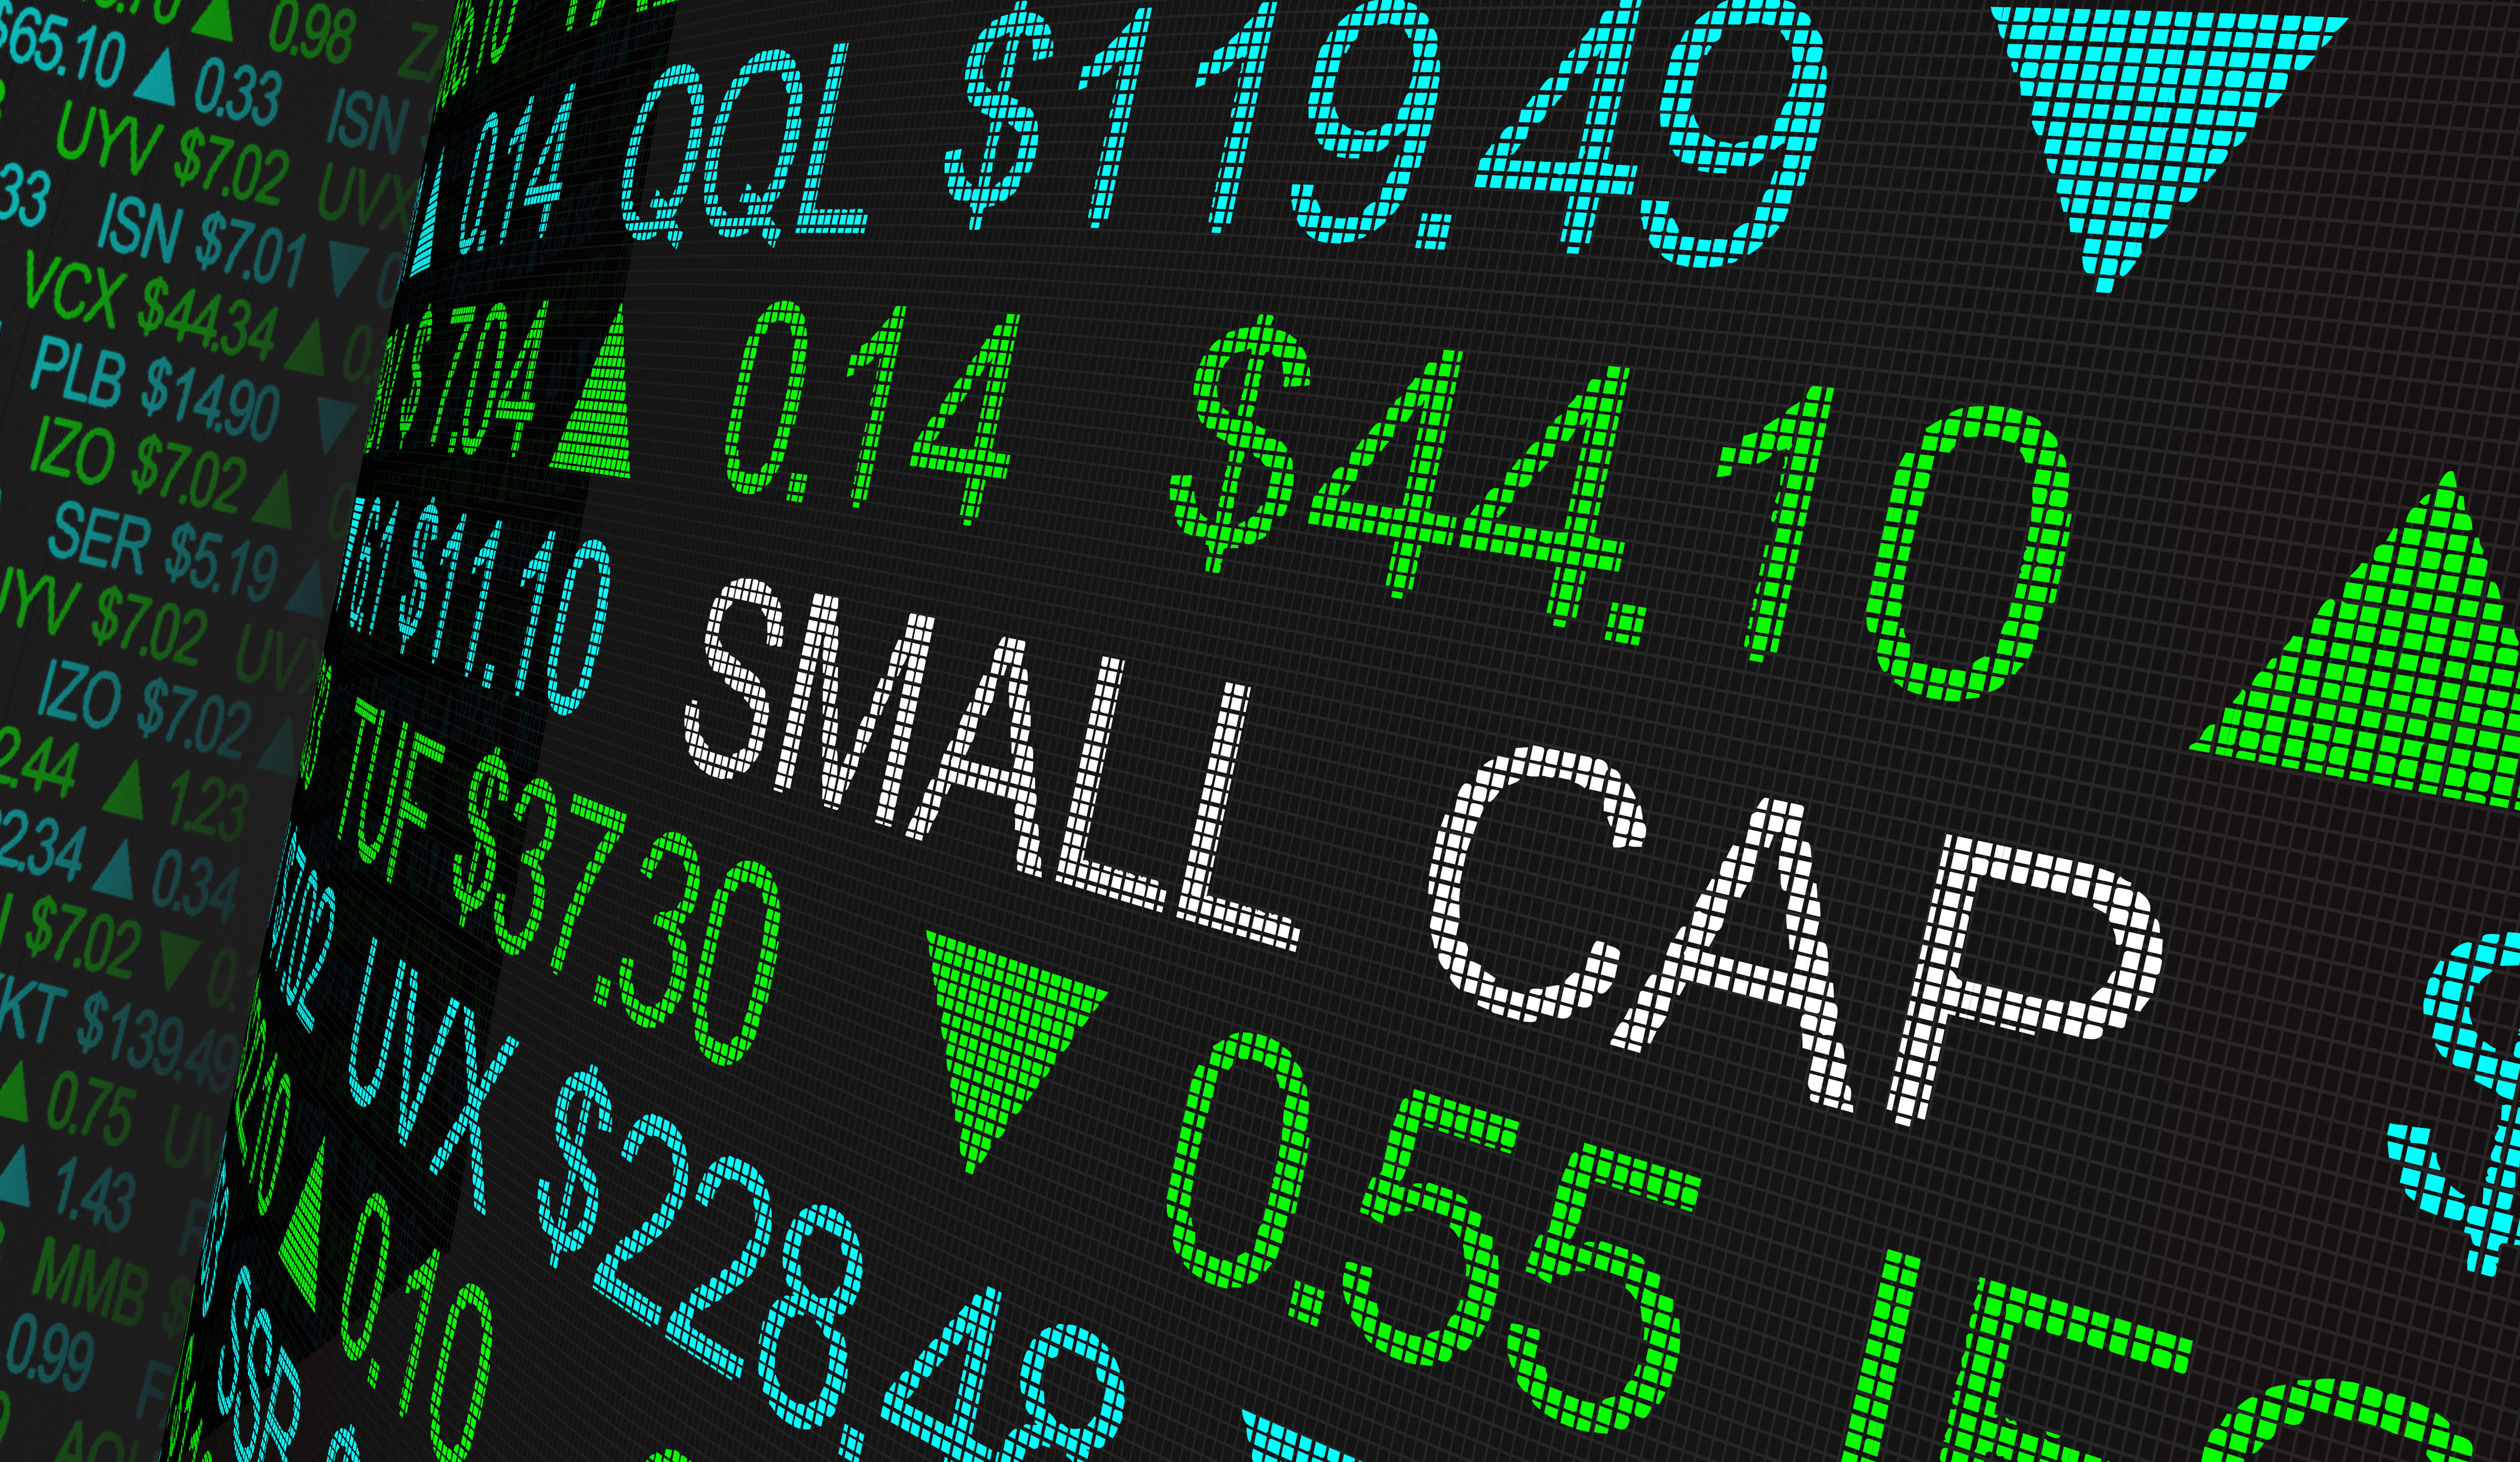
During the advance, the leadership broadened out from the narrow “Artificial Intelligence” and “Magnificent 7” theme. As shown in the table at right, off the short-term low of November 20, 2025, through January 2, 2026, five of the eleven S&P sector indexes beat the broad 1500 Index, as did the Small-Cap 600 Index. In fact, Information Technology, a previous leader, lagged the 1500. We expect the year-end theme to continue in 2026. Fed easing, either modest or potentially turbocharged, is good for small caps, Financials, and cyclicals like Industrials and Materials. Based on value, correlation, sentiment, and volatility, we do not see the behaviors that often accompany market peaks. We expect the broad market to move higher in 2026.
The data quoted represents past performance, which is no guarantee of future results. Opinions and forecasts regarding sectors, industries, companies, countries and/or themes, and portfolio composition and holdings, are all subject to change at any time, based on market and other conditions, and should not be construed as a recommendation of any specific security, industry, or sector.
Investing in securities involves inherent risks, including the risk that you can lose the value of your investment. An investment concentrated in sectors and industries may involve greater risk and volatility than a more diversified investment. Investments in international securities may entail unique risks, including political, market, regulatory, and currency risks. In general, there is less governmental supervision of foreign stock exchanges and securities brokers and issuers. Investing in fixed-income securities such as bonds involves interest rate risk. When interest rates rise, the value of fixed-income securities generally decreases.
Individual account holdings and composition may vary. Opinions and forecasts regarding sectors, industries, companies, countries and/or themes, and portfolio composition and holdings, are all subject to change at any time, based on market and other conditions, and should not be construed as a recommendation of any specific security, industry, or sector.
ICON’s value-based investing model is an analytical, quantitative approach to investing that employs various factors, including projected earnings growth estimates and bond yields, in an effort to determine whether securities are over- or underpriced relative to ICON’s estimates of their intrinsic value. ICON’s value approach involves forward-looking statements and assumptions based on judgments and projections that are neither predictive nor guarantees of future results. Value readings are contingent on several variables, including, without limitation, earnings, growth estimates, interest rates, and overall market conditions. Although valuation readings serve as guidelines for our investment decisions, we retain the discretion to buy and sell securities that fall beyond these guidelines as needed. Value investing involves risks and uncertainties and does not guarantee better performance or lower costs than other investment methodologies.
ICON’s value-to-price ratio is a ratio of the intrinsic value, as calculated using ICON’s proprietary valuation methodology, of a broad range of domestic and international securities within ICON’s system as compared to the current market price of those securities. According to our methodology, a V/P reading of 1.00 indicates stocks are priced at intrinsic value. We believe stocks with a V/P reading below 1.00 are overvalued, while stocks with a V/P reading above 1.00 are undervalued. For example, we interpret a V/P reading of 1.15 to mean that for every $1.00 of market value, there is $1.15 of intrinsic value which has not yet been realized in the market price.
The unmanaged Standard & Poor’s Composite 1500 (S&P 1500) Index is a broad-based capitalization-weighted index comprising 1,500 stocks of Large-cap, Mid-cap, and Small-cap U.S. companies. The SmallCap 600 Index is an unmanaged index of 600 domestic stocks chosen for their market capitalization, liquidity, financial viability, and sector representation. The unmanaged Standard & Poor’s (S&P) Composite 1500 Sector Indexes track the performance of sectors that comprise the S&P Composite 1500 Index. Total return figures for the unmanaged sector indexes do include the reinvestment of dividends and capital gain distributions, but do not reflect the costs of managing a mutual fund. The Standard and Poor’s (S&P) 1500 Consumer Discretionary Index is an unmanaged capitalization-weighted index comprising companies in the Consumer Discretionary sector as determined by S&P. Total returns for the unmanaged index include the reinvestment of dividends and capital gain distributions beginning on January 1, 2002. Index returns with reinvested dividends and distributions are unavailable prior to that date. The Standard and Poor’s (S&P) 1500 Consumer Staples Index is an unmanaged capitalization-weighted index comprising companies in the Consumer Staples sector as determined by S&P. The Standard and Poor’s (S&P) 1500 Energy Index is an unmanaged capitalization-weighted index comprising companies in the Energy sector as determined by S&P. The Standard and Poor’s (S&P) 1500 Financials Index is an unmanaged capitalization-weighted index comprising companies in the Financials sector as determined by S&P. The Standard and Poor’s (S&P) 1500 Healthcare Index is an unmanaged capitalization-weighted index comprising companies in the Healthcare sector as determined by S&P. The Standard and Poor’s (S&P) 1500 Information Technology Index is an unmanaged capitalization-weighted index comprising companies in the Information Technology sector as determined by S&P. The Standard and Poor’s (S&P) 1500 Materials Index is an unmanaged capitalization-weighted index comprising companies in the Materials sector as determined by S&P. The Standard and Poor’s (S&P) 1500 Industrials Index is an unmanaged capitalization-weighted index comprising companies in the Industrials sector as determined by S&P. Total returns for the S&P 1500 Industrials Index include the reinvestment of dividends and capital gain distributions beginning on January 1, 2002. Index returns with reinvested dividends and distributions are unavailable prior to that date. The Standard and Poor’s (S&P) 1500 Real Estate Index is an unmanaged capitalization-weighted index comprising companies in the Real Estate sector as determined by S&P. The Standard and Poor’s (S&P) 1500 Utilities Index is an unmanaged capitalization-weighted index comprising companies in the Utilities sector as determined by S&P. Individuals cannot invest directly in an index.
The 30-year yield is the benchmark 30-year yield to maturity reflected by the current issue of a U.S. Treasury debt obligation that has a maturity of 30 years.
Sources: Bloomberg
Please visit ICON online at ICONAdvisers.com or call 1-800-828-4881 for the most recent copy of ICON’s Form ADV, Part 2.
© 2026 ICON Advisers, All Rights Reserved.