 ICON Insights | January, 2024
Dr. Craig Callahan ICON Advisers – Founder & Executive Committee Chair
Equities
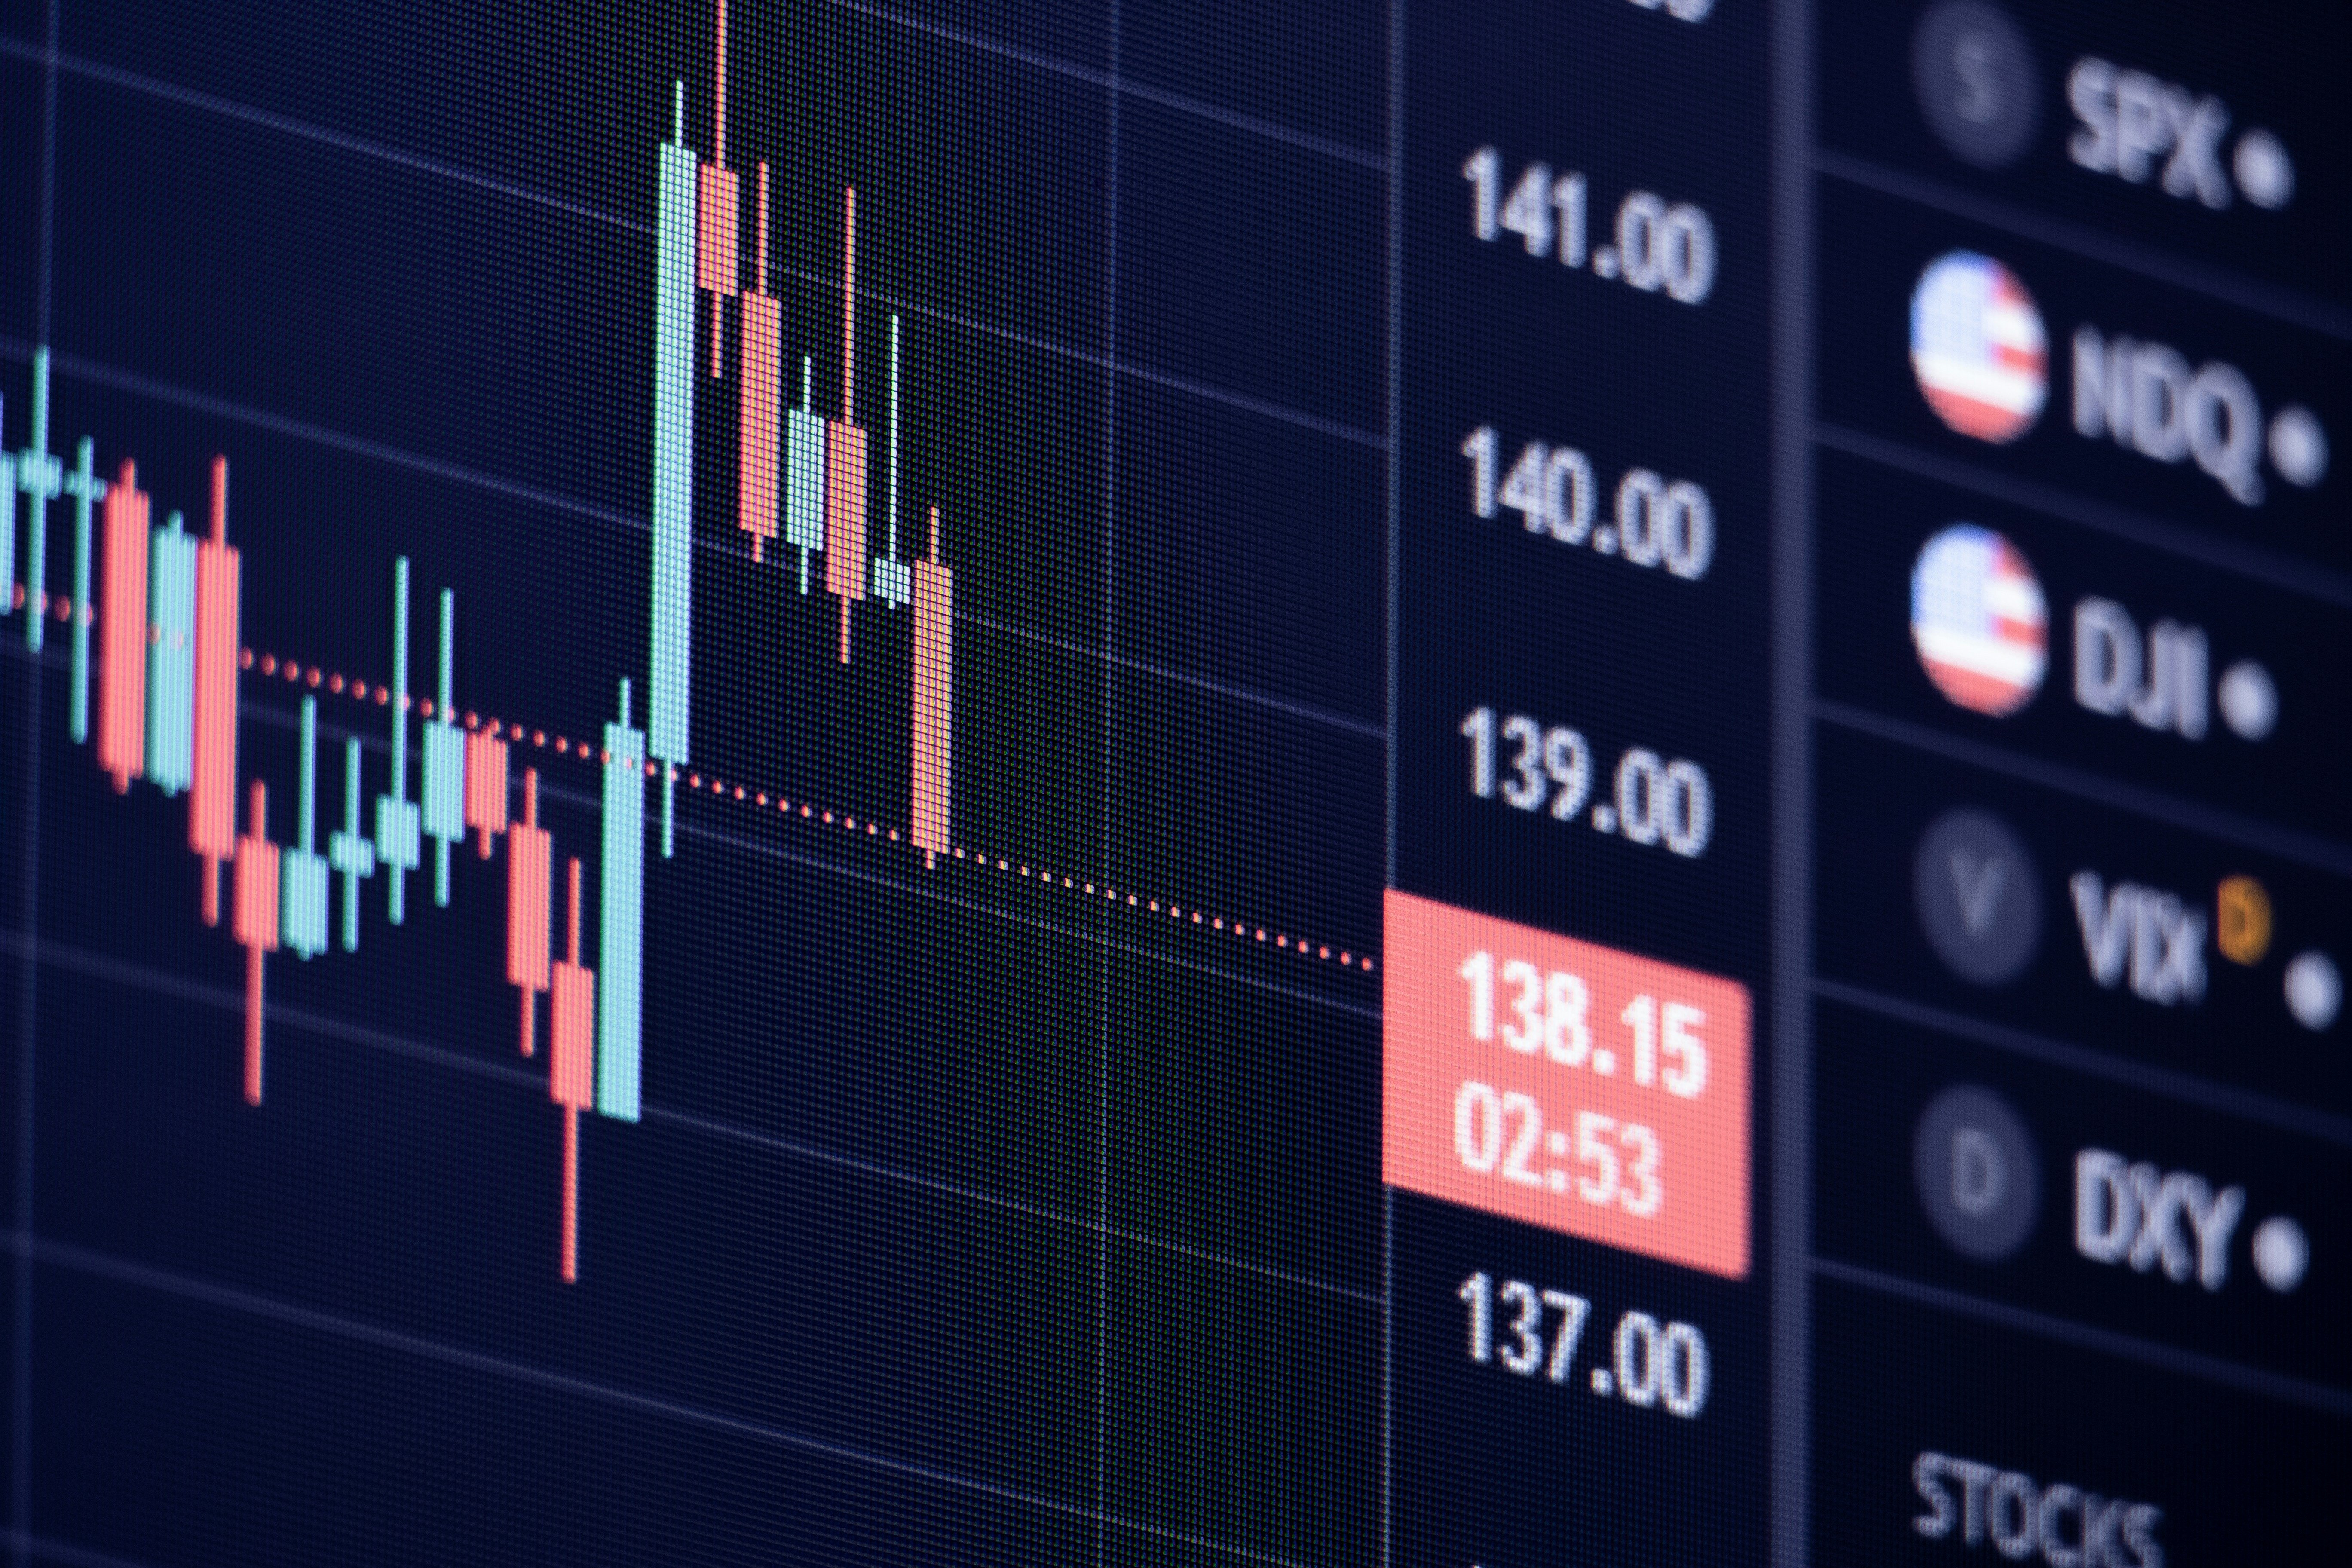
![]() After hitting a short-term low on October 27, 2023, the stock market came to life and rallied into early December. Investors appear to be pricing in the likelihood that inflation can come down to the Federal Reserve’s (Fed) target of near 2% without the economy entering a recession, a so-called soft landing. Some investors bidding stock prices higher during that advance believe the Fed may even reduce its Federal Funds target rate in 2024. ICON is not on that bandwagon. With an overall market Value/Price (V/P) ratio of 1.05, we do not need rate reductions to believe stock prices, on average, can move a bit higher in the coming months. In our view, value alone is adequate to support higher stock prices.
After hitting a short-term low on October 27, 2023, the stock market came to life and rallied into early December. Investors appear to be pricing in the likelihood that inflation can come down to the Federal Reserve’s (Fed) target of near 2% without the economy entering a recession, a so-called soft landing. Some investors bidding stock prices higher during that advance believe the Fed may even reduce its Federal Funds target rate in 2024. ICON is not on that bandwagon. With an overall market Value/Price (V/P) ratio of 1.05, we do not need rate reductions to believe stock prices, on average, can move a bit higher in the coming months. In our view, value alone is adequate to support higher stock prices.
The table shows sector index performance off the October 27th low through December 5th. The leaders are economically sensitive or cyclical. Three of the bottom four are the so-called recession proof, defensive sectors. This performance is consistent with investors fearing a recession in October, but instead in November expecting a soft landing. The Real Estate leadership can be explained by the recent bond rally as the yield on the 10-year Treasury note has dropped from 4.99% on October 19 to 4.17% on December 6. The real estate sector is loaded with real estate investment trusts (REITs) which are very “bond-like,” with high yields and minimal growth potential. There’s value in the other leading sectors like Consumer Discretionary, Financials and Industrials. But Information Technology is the one leader that in our view, is being driven by momentum, not value.
When we look at conditions and behaviors such as correlation among sectors, market volatility and sentiment, we do not see the extremes that often occur at market peaks. Given that, we believe this advance can grind forward and continue into 2024.
Bonds
From the end of August, 2023, the yield on the 10-year Treasury climbed from below 4.20% to almost 5.00% by mid-October, but since that peak the yield has reversed and dropped back to the level of late August. We had thought a bond rally, and a decline in rates was possible, but we did not expect it so soon. Instead, we expected the yield would bump its head a few times on the 5.00% ceiling before dropping. there’s potential for the yield to be volatile in the coming months as investors have shown the tendency to rapidly reverse their expectations for overall economic strength and for Federal Reserve behavior.
Summary
We believe the market can grind higher into 2024. We use the word “grind” because of the tug of war between investors who believe in the soft landing, a recession, and the Fed lowering rates/keeping rates higher for longer. Relying on value rather than guessing in those potential situations, we believe it is prudent to own equities.
The data quoted represents past performance, which is no guarantee of future results. Opinions and forecasts regarding sectors, industries, companies, countries and/or themes, and portfolio composition and holdings, are all subject to change at any time, based on market and other conditions, and should not be construed as a recommendation of any specific security, industry, or sector.
Investing in securities involves inherent risks, including the risk that you can lose the value of your investment. An investment concentrated in sectors and industries may involve greater risk and volatility than a more diversified investment. Investments in international securities may entail unique risks, including political, market, regulatory and currency risks. In general, there is less governmental supervision of foreign stock exchanges and securities brokers and issuers. Investing in fixed income securities such as bonds involves interest rate risk. When interest rates rise, the value of fixed income securities generally decreases.
Individual account holdings and composition may vary. Opinions and forecasts regarding sectors, industries, companies, countries and/or themes, and portfolio composition and holdings, are all subject to change at any time, based on market and other conditions, and should not be construed as a recommendation of any specific security, industry, or sector.
ICON’s value-based investing model is an analytical, quantitative approach to investing that employs various factors, including projected earnings growth estimates and bond yields, in an effort to determine whether securities are over- or underpriced relative to ICON’s estimates of their intrinsic value. ICON’s value approach involves forward-looking statements and assumptions based on judgments and projections that are neither predictive nor guarantees of future results. Value readings are contingent on several variables including, without limitation, earnings, growth estimates, interest rates and overall market conditions. Although valuation readings serve as guidelines for our investment decisions, we retain the discretion to buy and sell securities that fall beyond these guidelines as needed. Value investing involves risks and uncertainties and does not guarantee better performance or lower costs than other investment methodologies.
ICON’s value-to-price ratio is a ratio of the intrinsic value, as calculated using ICON’s proprietary valuation methodology, of a broad range of domestic and international securities within ICON’s system as compared to the current market price of those securities. According to our methodology, a V/P reading of 1.00 indicates stocks are priced at intrinsic value. We believe stocks with a V/P reading below 1.00 are overvalued while stocks with a V/P reading above 1.00 are undervalued. For example, we interpret a V/P reading of 1.15 to mean that for every $1.00 of market value, there is $1.15 of intrinsic value which has not yet been realized in the market price.
The unmanaged Standard & Poor’s Composite 1500 (S&P 1500) Index is a broad-based capitalization-weighted index comprising 1,500 stocks of Large-cap, Mid-cap, and Small-cap U.S. companies. The unmanaged Standard & Poor’s (S&P) SmallCap 600 Index is an unmanaged index of 600 domestic stocks chosen for their market capitalization, liquidity, financial viability, and sector representation. The unmanaged Standard & Poor’s (S&P) 500 Index is a market value-weighted index of large-cap common stocks considered representative of the broad market. The unmanaged Standard & Poor’s (S&P) Composite 1500 Sector Indexes track the performance of sectors that comprise the S&P Composite 1500 Index. Total return figures for the unmanaged sector indexes do include the reinvestment of dividends and capital gain distributions but do not reflect the costs of managing a mutual fund. The Standard and Poor’s (S&P) 1500 Consumer Discretionary Index is an unmanaged capitalization-weighted index comprising companies in the Consumer Discretionary sector as determined by S&P. Total returns for the unmanaged index include the reinvestment of dividends and capital gain distributions beginning on January 1, 2002. Index returns with reinvested dividends and distributions are unavailable prior to that date. The Standard and Poor’s (S&P) 1500 Consumer Staples Index is an unmanaged capitalization-weighted index comprising companies in the Consumer Staples sector as determined by S&P. The Standard and Poor’s (S&P) 1500 Energy Index is an unmanaged capitalization-weighted index comprising companies in the Energy sector as determined by S&P. The Standard and Poor’s (S&P) 1500 Financials Index is an unmanaged capitalization-weighted index comprising companies in the Financials sector as determined by S&P. The Standard and Poor’s (S&P) 1500 Healthcare Index is an unmanaged capitalization-weighted index comprising companies in the Healthcare sector as determined by S&P. The Standard and Poor’s (S&P) 1500 Information Technology Index is an unmanaged capitalization-weighted index comprising companies in the Information Technology sector as determined by S&P. The Standard and Poor’s (S&P) 1500 Materials Index is an unmanaged capitalization-weighted index comprising companies in the Materials sector as determined by S&P. The Standard and Poor’s (S&P) 1500 Industrials Index is an unmanaged capitalization-weighted index comprising companies in the Industrials sector as determined by S&P. Total returns for the S&P 1500 Industrials Index include the reinvestment of dividends and capital gain distributions beginning on January 1, 2002. Index returns with reinvested dividends and distributions are unavailable prior to that date. The Standard and Poor’s (S&P) 1500 Real Estate Index is an unmanaged capitalization-weighted index comprising companies in the Real Estate sector as determined by S&P. The Standard and Poor’s (S&P) 1500 Utilities Index is an unmanaged capitalization-weighted index comprising companies in the Utilities sector as determined by S&P. The Russell 2000 is an unmanaged index comprising common stocks of the 2,000 U.S. public companies next in size after the largest 1,000 publicly traded U.S. companies. Individuals cannot invest directly in an index.
The 10-year yield is the benchmark 10-year yield to maturity reflected by the current issue 10 year U.S. Treasury note.
Sources: Bloomberg
Please visit ICON online at ICONAdvisers.com or call 1-800-828-4881 for the most recent copy of ICON’s Form ADV, Part 2.
© 2024 ICON Advisers, All Rights Reserved.